
How to Read a Lithium Battery Datasheet: Why Higher mAh Can Deliver Less Runtime

Technically Reviewed By
Dr. Maximilian Weber
Chief Scientist
Dr. Maximilian Weber is THOR Power’s Chief Scientist and a senior expert in lithium battery technology. His technical review focuses on battery safety, performance optimization, energy density and custom battery solution development.
Last technical review: September 2026

Written By
Victor Xiong
President of OEM Division & Custom Battery Specialist
Victor Xiong holds a Master’s degree from The Chinese University of Hong Kong, Shenzhen. He leads THOR Power’s OEM Division and focuses on custom battery solutions for global device brands, product developers and industrial customers.
Last technical review: August 2026
The Real Problem: The Battery Has Capacity, but the Product Cannot Use It
An OEM team upgrades a product from a 4500 mAh cell to a 5000 mAh cell and expects longer runtime. In the lab, the product runs normally at full charge. In field use, it resets during a motor start, shuts down at low state of charge, or shows 15% remaining capacity before suddenly dying. Purchasing sees a larger mAh number; engineering sees a voltage-margin problem.
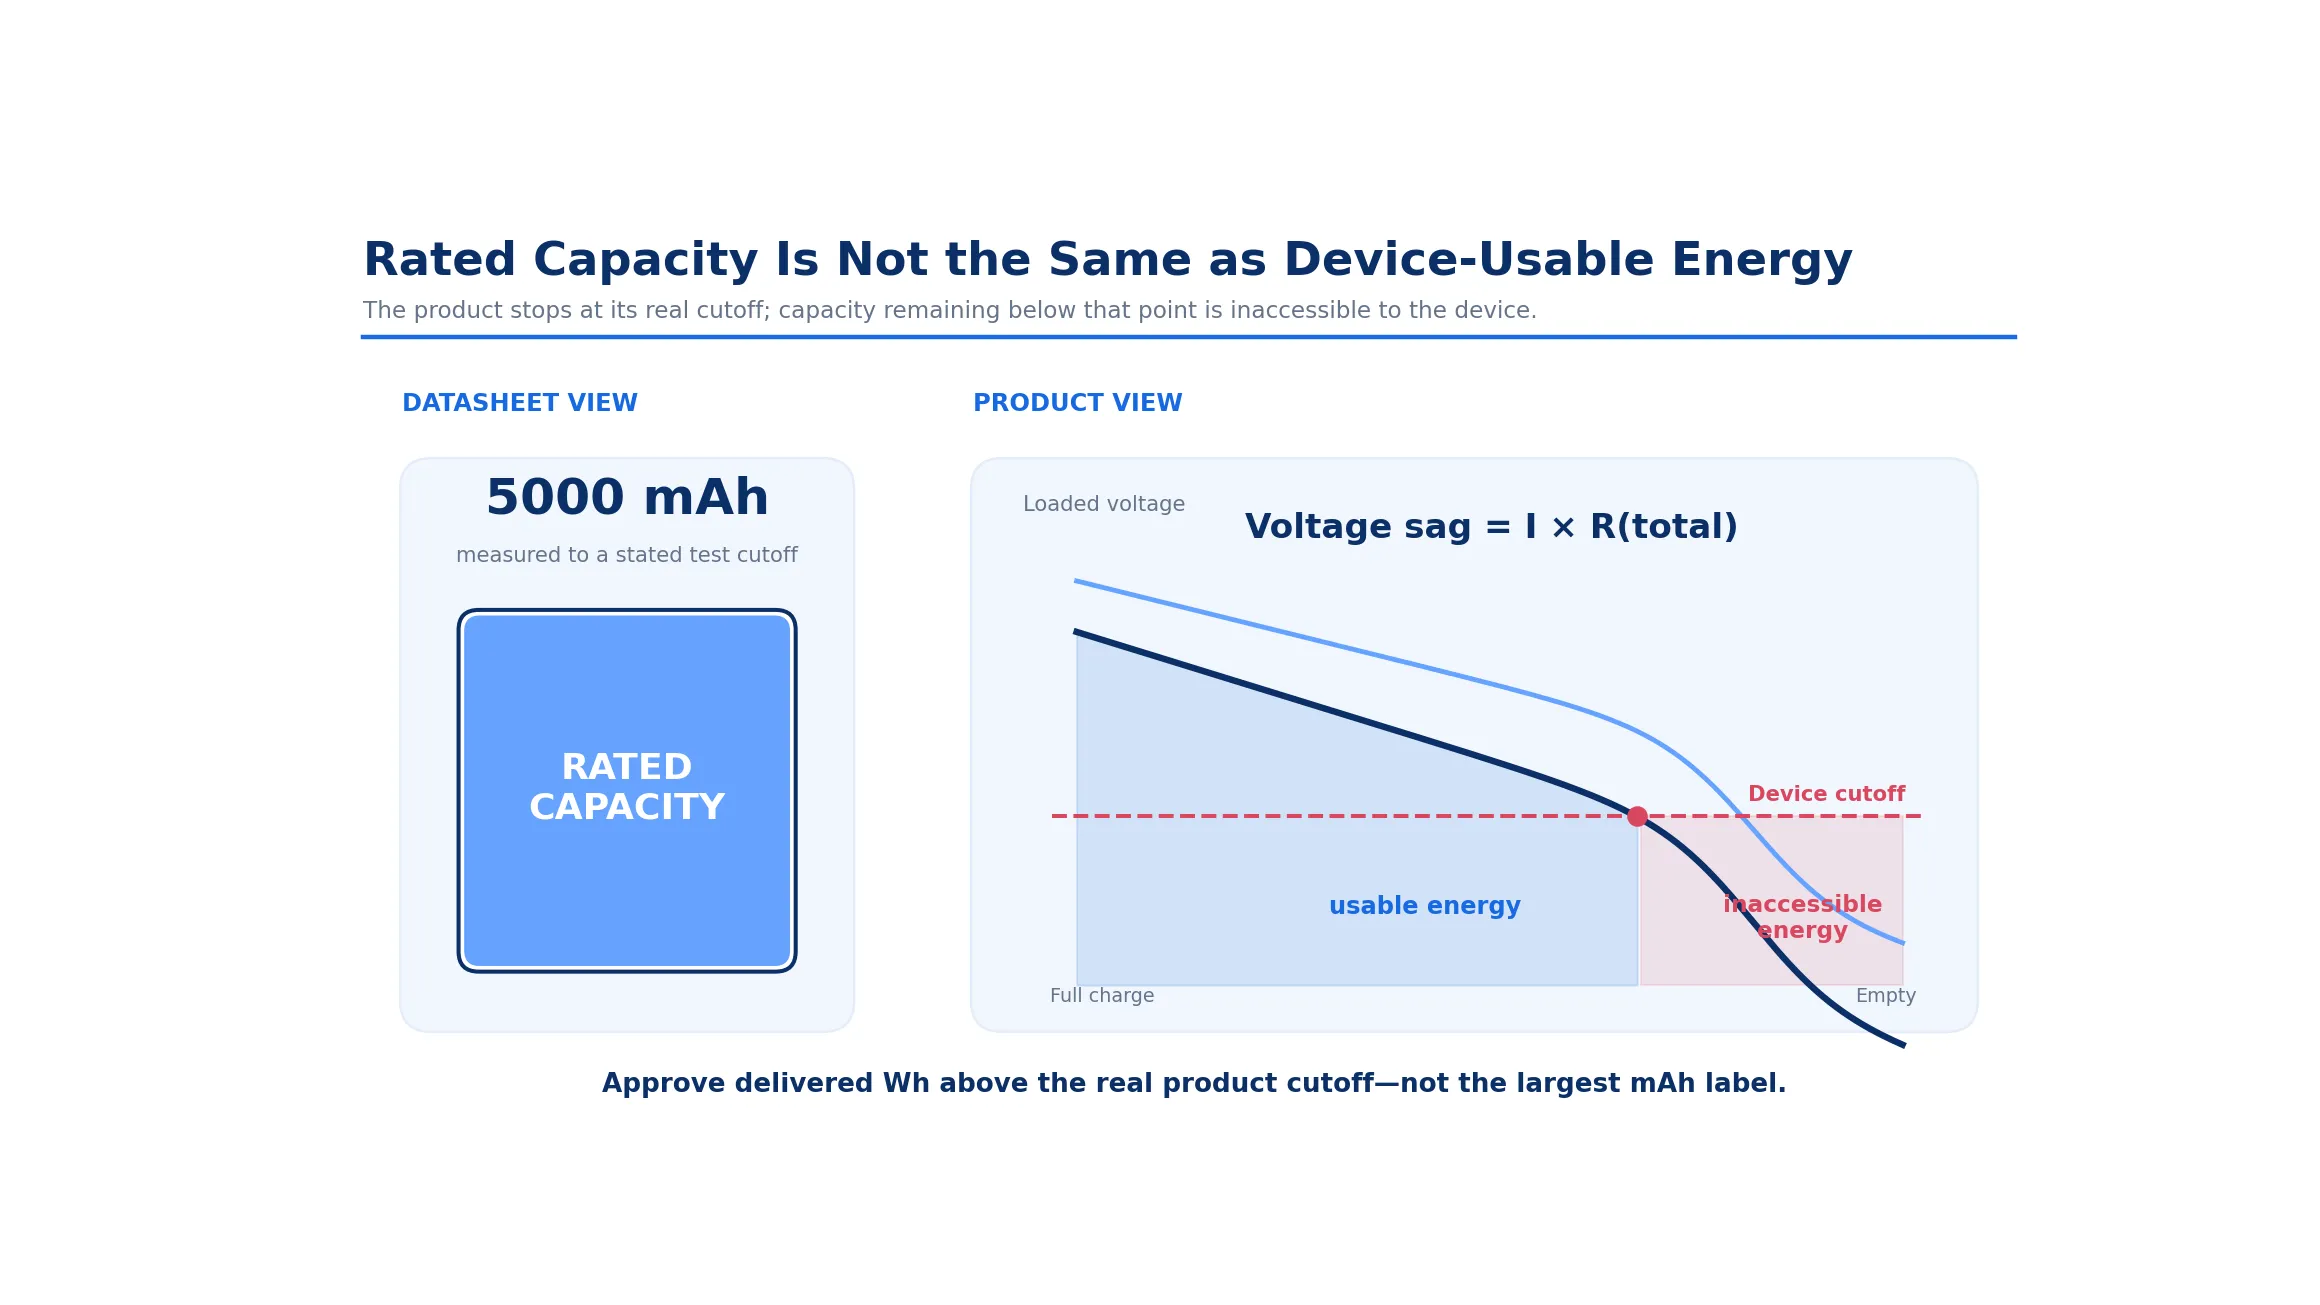
This is the datasheet trap. Capacity is measured under defined test conditions, often at a current and cutoff that the final product may never use. The customer problem is not that the datasheet is wrong. The problem is that the product is asking a different question: how much energy reaches the device before loaded voltage, temperature, protection or firmware cutoff reaches its limit? For cylindrical OEM projects, evaluate candidates inside controlled 18650 and 21700 battery-pack configurations rather than as isolated cells.
If your team is still converting capacity into runtime from nominal watt-hours, use the Battery Runtime Calculation Guide first. This article goes one layer deeper: it explains why two cells with similar format and voltage can deliver different usable energy under the same real load.
Lithium Battery Datasheet & Runtime Review Checklist
Compare capacity, resistance, loaded voltage, cutoff, thermal limits and validation evidence before approving an exact cell.
Capacity Is Charge Measured to a Test Cutoff, Not Product Runtime
A capacity value in amp-hours answers a narrow laboratory question: how much charge left the cell between a specified full-charge condition and a specified discharge cutoff under a stated current and temperature. It does not directly answer how much energy a product can use.
The difference matters because most products stop above the cell datasheet cutoff. A cell can still contain electrochemical capacity after the device has shut down. That remaining capacity may be inaccessible because the load causes too much voltage sag, the converter needs a higher input voltage, the BMS protects a weak series group, or the firmware defines a conservative shutdown threshold. For first-order energy sizing before exact-cell comparison, use the LiPo Battery Capacity for Device Runtime guide.
Use three separate quantities: charge capacity Q = integral of I dt; cell energy E_cell = integral of V_cell x I dt; device-usable energy E_useful = integral of P_device dt until the first real system limit is reached. For low-current products with a wide input range, mAh may correlate with runtime. For motors, heaters, radios, pumps, robotics and regulated electronics, the discharge curve and cutoff margin often matter more.
Loaded Voltage Is the Missing Link Between the Datasheet and the Product
The first useful model separates relaxed battery voltage from voltage lost inside the cell and current path: V_load = V_OCV – I x R_total. R_total includes cell dynamic resistance plus tabs, welds, BMS MOSFETs, fuse, connector, wire and device contacts.
For a constant-current load, current remains approximately fixed and voltage sag grows with resistance. A constant-power load is harsher because current rises as voltage falls: I = P / V_load. Combining the two relationships gives the screening equation V_load^2 – V_OCV x V_load + P x R_total = 0. The physically relevant solution is the higher positive root. If V_OCV^2 – 4 x P x R_total is negative, this simplified model has no steady operating point; equivalently, P_max = V_OCV^2 / (4 x R_total). This is a screening boundary, not a substitute for dynamic cell data or final-device testing.
This feedback explains a common field symptom: the device runs normally at full charge, then loses margin abruptly in the lower half of SOC. Lower cell voltage demands more current from the load; more current creates more voltage drop and heat; the product reaches its cutoff even though a low-rate capacity test would continue.
The non-cell part of R_total is often overlooked. Check the Connector, Wire Gauge and NTC Selection Guide whenever voltage sag appears only after the cell is assembled into the finished pack.
Official 21700 Comparison: More Energy vs Lower Impedance
The Molicel INR-21700-M50A and INR-21700-P45B are useful teaching examples because they come from the same manufacturer, use the same cylindrical format and share the same nominal, charge and datasheet discharge voltages. Their published priorities are different.
| Published item | INR-21700-M50A | INR-21700-P45B | Engineering meaning |
|---|---|---|---|
| Typical capacity / energy | 5000 mAh / 18.0 Wh | 4500 mAh / 16.2 Wh | M50A has about 11% more headline energy under the published values. |
| Minimum capacity / energy | 4800 mAh / 17.3 Wh | 4300 mAh / 15.5 Wh | Minimum values matter for conservative production planning. |
| Continuous discharge current | 20 A | 45 A with 80°C cut-off | P45B is positioned for much higher current. |
| Typical AC impedance | 15 mΩ at 1 kHz | 7 mΩ at 30% SOC | Conditions differ, but P45B signals a lower-impedance design. |
| Typical DC impedance | 25 mΩ at 10 A / 10 s | 15 mΩ at 50% SOC | Useful for screening; not directly interchangeable test conditions. |
| Standard charge current | 2.5 A | 4.5 A | Charge and life conditions must be checked separately. |
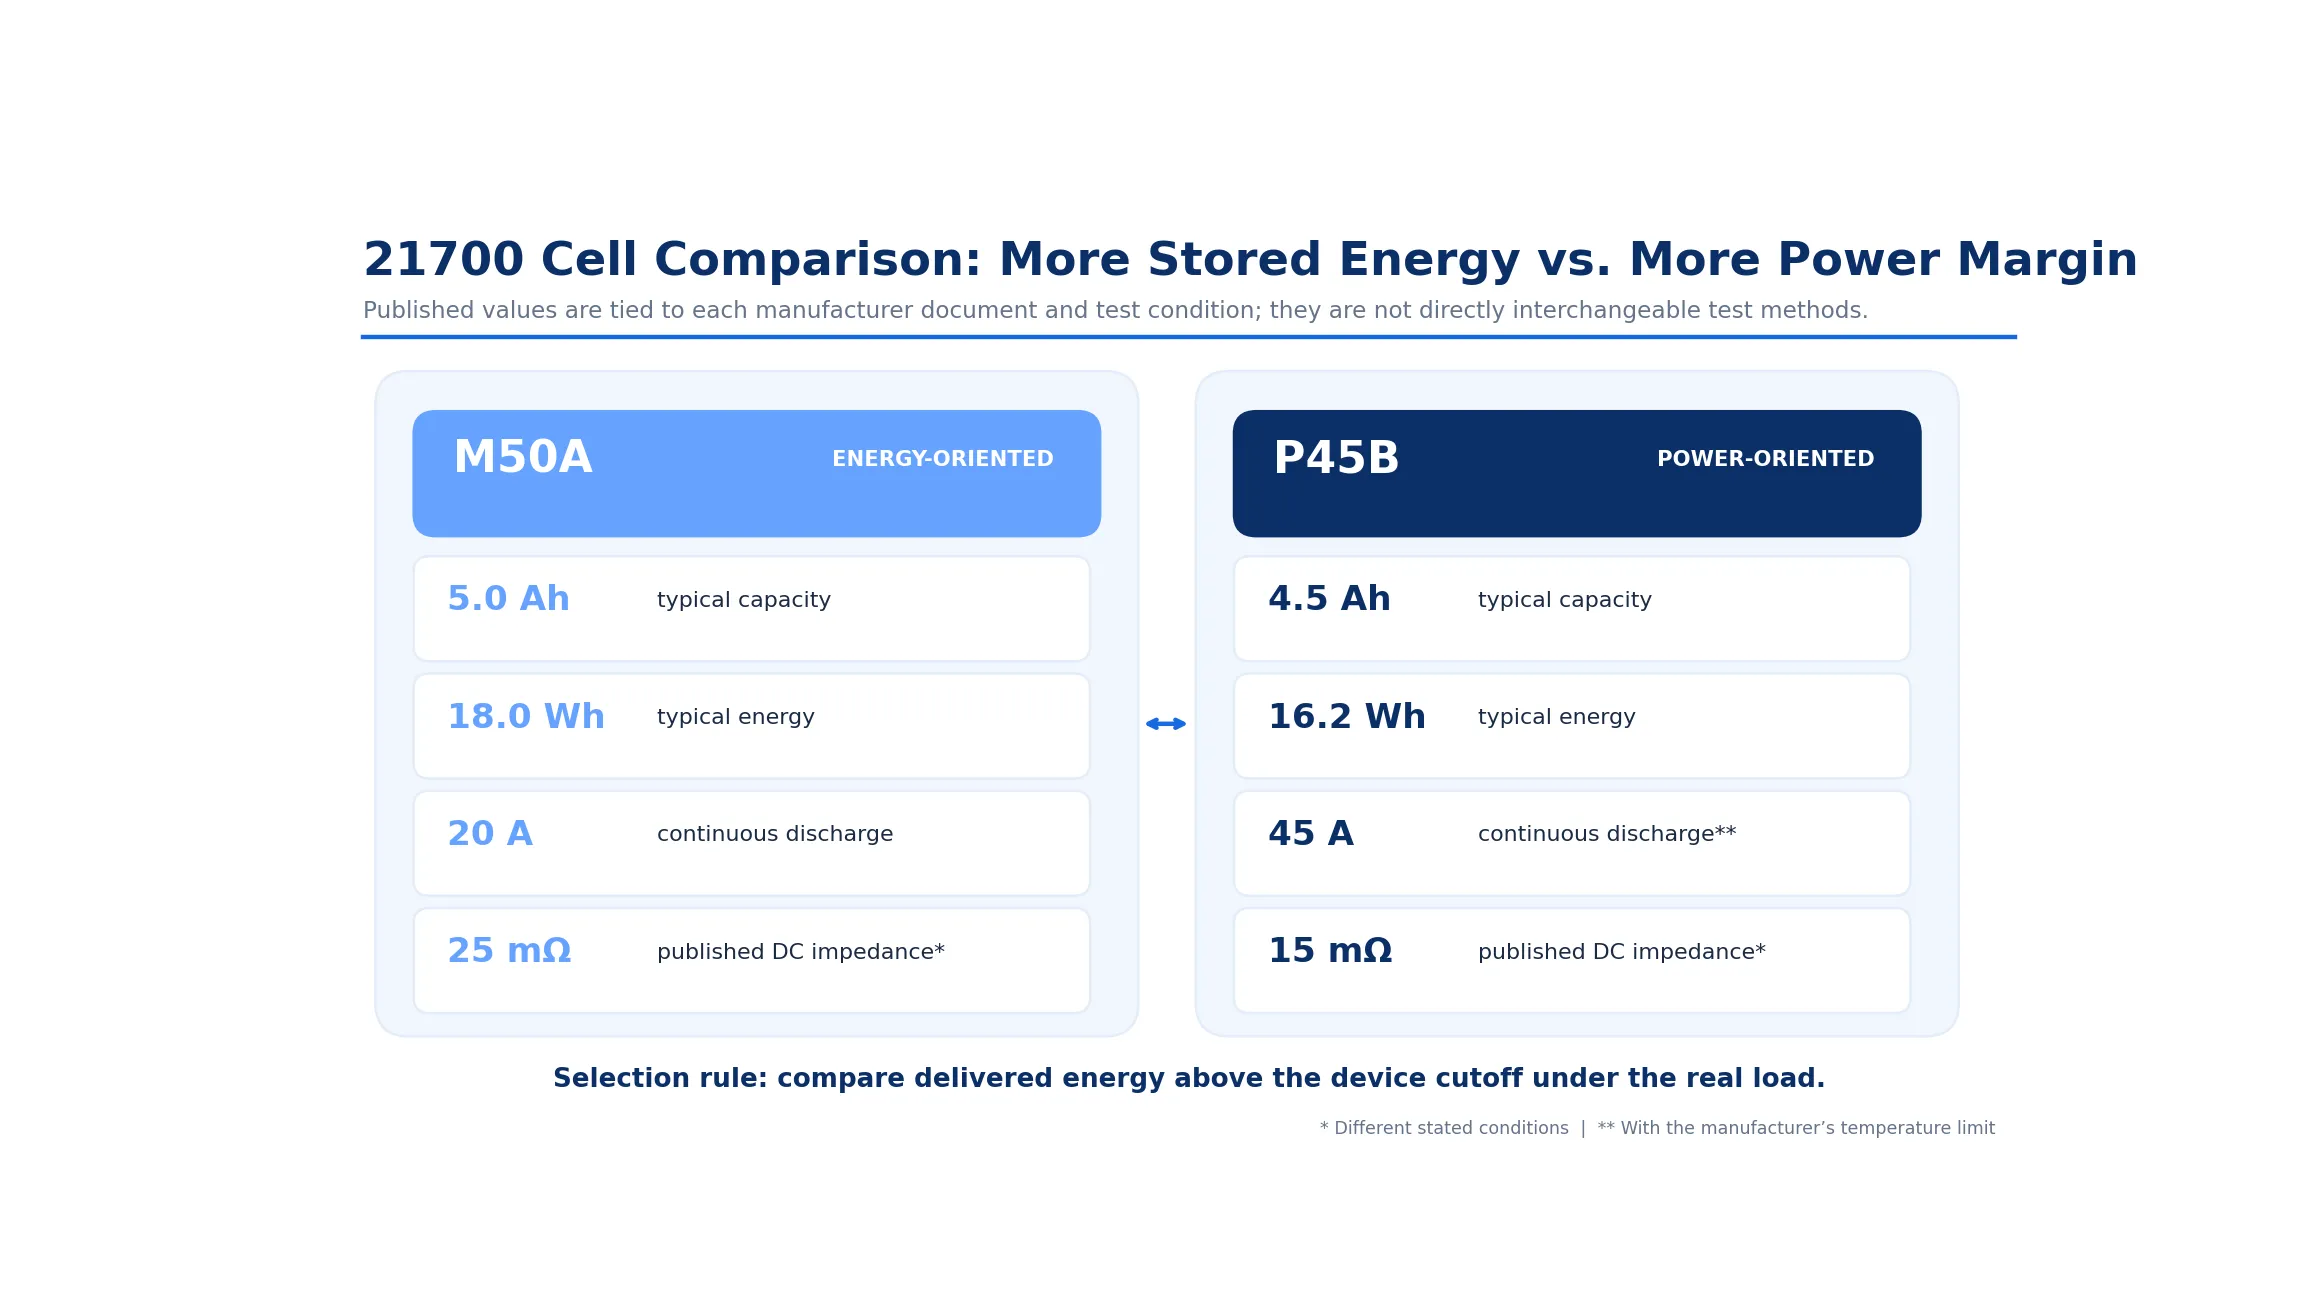
Evidence boundary: The comparison uses the exact document values listed in the article master. M50A is not shown in Molicel’s current product portfolio; confirm the archived datasheet revision and current supply route before procurement or design release.
M50A is stronger when the product can actually use its extra capacity without crossing voltage, current or temperature limits. P45B is stronger when loaded voltage and pulse power decide whether the product remains operational. The deciding metric is delivered energy to the device cutoff under the real duty cycle, not the largest capacity number.
For OEM projects already evaluating cylindrical formats, start from controlled 18650 and 21700 battery packs rather than treating same-size cells as automatic substitutes.
Higher-Capacity Cell Still Shutting Down Early?
Send the device voltage window, real load waveform and cutoff behavior. THOR Power can compare exact cells and the complete current path before a substitution is approved.
Worked 2S / 100 W Example: How 5000 mAh Can Shut Down First
Consider a 2S pack powering a regulated 100 W motor controller. The controller shuts down at 5.8 V. At the checked operating point, the two cells have a combined open-circuit voltage of 6.9 V. The non-cell current path adds 20 mΩ.
For screening only, use the published DC impedance values as approximate cell resistances. This is not a product guarantee; it shows how sensitive a cutoff-limited system is to resistance.
| Screening result | M50A-based 2S pack | P45B-based 2S pack |
|---|---|---|
| Cell resistance in 2S | 2 x 25 mΩ = 50 mΩ | 2 x 15 mΩ = 30 mΩ |
| Total pack resistance | 50 + 20 = 70 mΩ | 30 + 20 = 50 mΩ |
| Calculated loaded voltage | 5.66 V | 6.08 V |
| Calculated battery current | 17.7 A | 16.5 A |
| Estimated I2R loss | 21.8 W | 13.5 W |
| Result vs 5.8 V cutoff | Device shuts down | Device continues operating |

The M50A still has more nominal energy, but the 100 W load cannot reach that energy because the calculated loaded voltage is below the product cutoff. The P45B uses a smaller nameplate energy store but makes more of it accessible at this operating point.
This is also why increasing capacity can make a product heavier and more expensive without fixing the complaint. The root problem may be the cell power design, the number of parallel paths, the BMS MOSFET loss, connector resistance, wire length or cutoff strategy.
How to Read ACIR, DCIR and Discharge Curves Together
No single resistance number predicts every load. AC impedance is fast and repeatable, so it is useful for incoming inspection and lot screening. A 1 kHz ACIR value does not reproduce a multi-second motor pulse. DC resistance is closer to the product problem, but its result depends on pulse amplitude, duration, SOC, temperature and exact voltage sampling points.
Use time-specific DC resistance instead of one vague number. For a current step delta I, calculate R(t) = [V_before – V(t)] / delta I at defined times such as 100 ms, 1 s and 10 s. The 100 ms value emphasizes fast ohmic response; longer values include more polarization. Record voltage recovery after the pulse as a separate result.
Discharge curves then show how behavior evolves across capacity. Read the curve at the load current closest to the application, not only at the endpoint. Note the voltage plateau, knee location, final cutoff and test temperature. For constant-power products, a constant-power curve or product waveform test is more useful than a low-rate constant-current curve.
Because cutoff is often enforced by protection hardware or firmware, review the PCM/BMS Selection Guide before approving a new cell only from a datasheet curve.
Cold, Low SOC and Aging Often Reverse the Datasheet Ranking
Low temperature raises cell resistance and reduces loaded voltage. A capacity-oriented cell that looks acceptable at 23°C may reach cutoff much earlier at 0°C or below. The correct cold test is not only a low-rate capacity test; it is the real load applied from the intended starting temperature and SOC.
Low SOC changes both open-circuit voltage and effective resistance. The weakest region is often where the product still expects full power while the battery voltage has already fallen. Plot minimum loaded voltage against SOC instead of reporting only one runtime number.
Aging reduces capacity and usually increases resistance. For a power-limited product, resistance growth can end useful life before capacity retention reaches the conventional 80% threshold. A customer may see this as a warranty problem: the battery still tests above 80% capacity at a gentle rate, but the product can no longer start, transmit, heat or move reliably.
Use the Battery Pack Thermal Management Guide when repeated duty, enclosure heat, connector loss or low-temperature recovery can decide whether the approved cell remains safe and usable.
The Five Tests That Close the Datasheet Gap
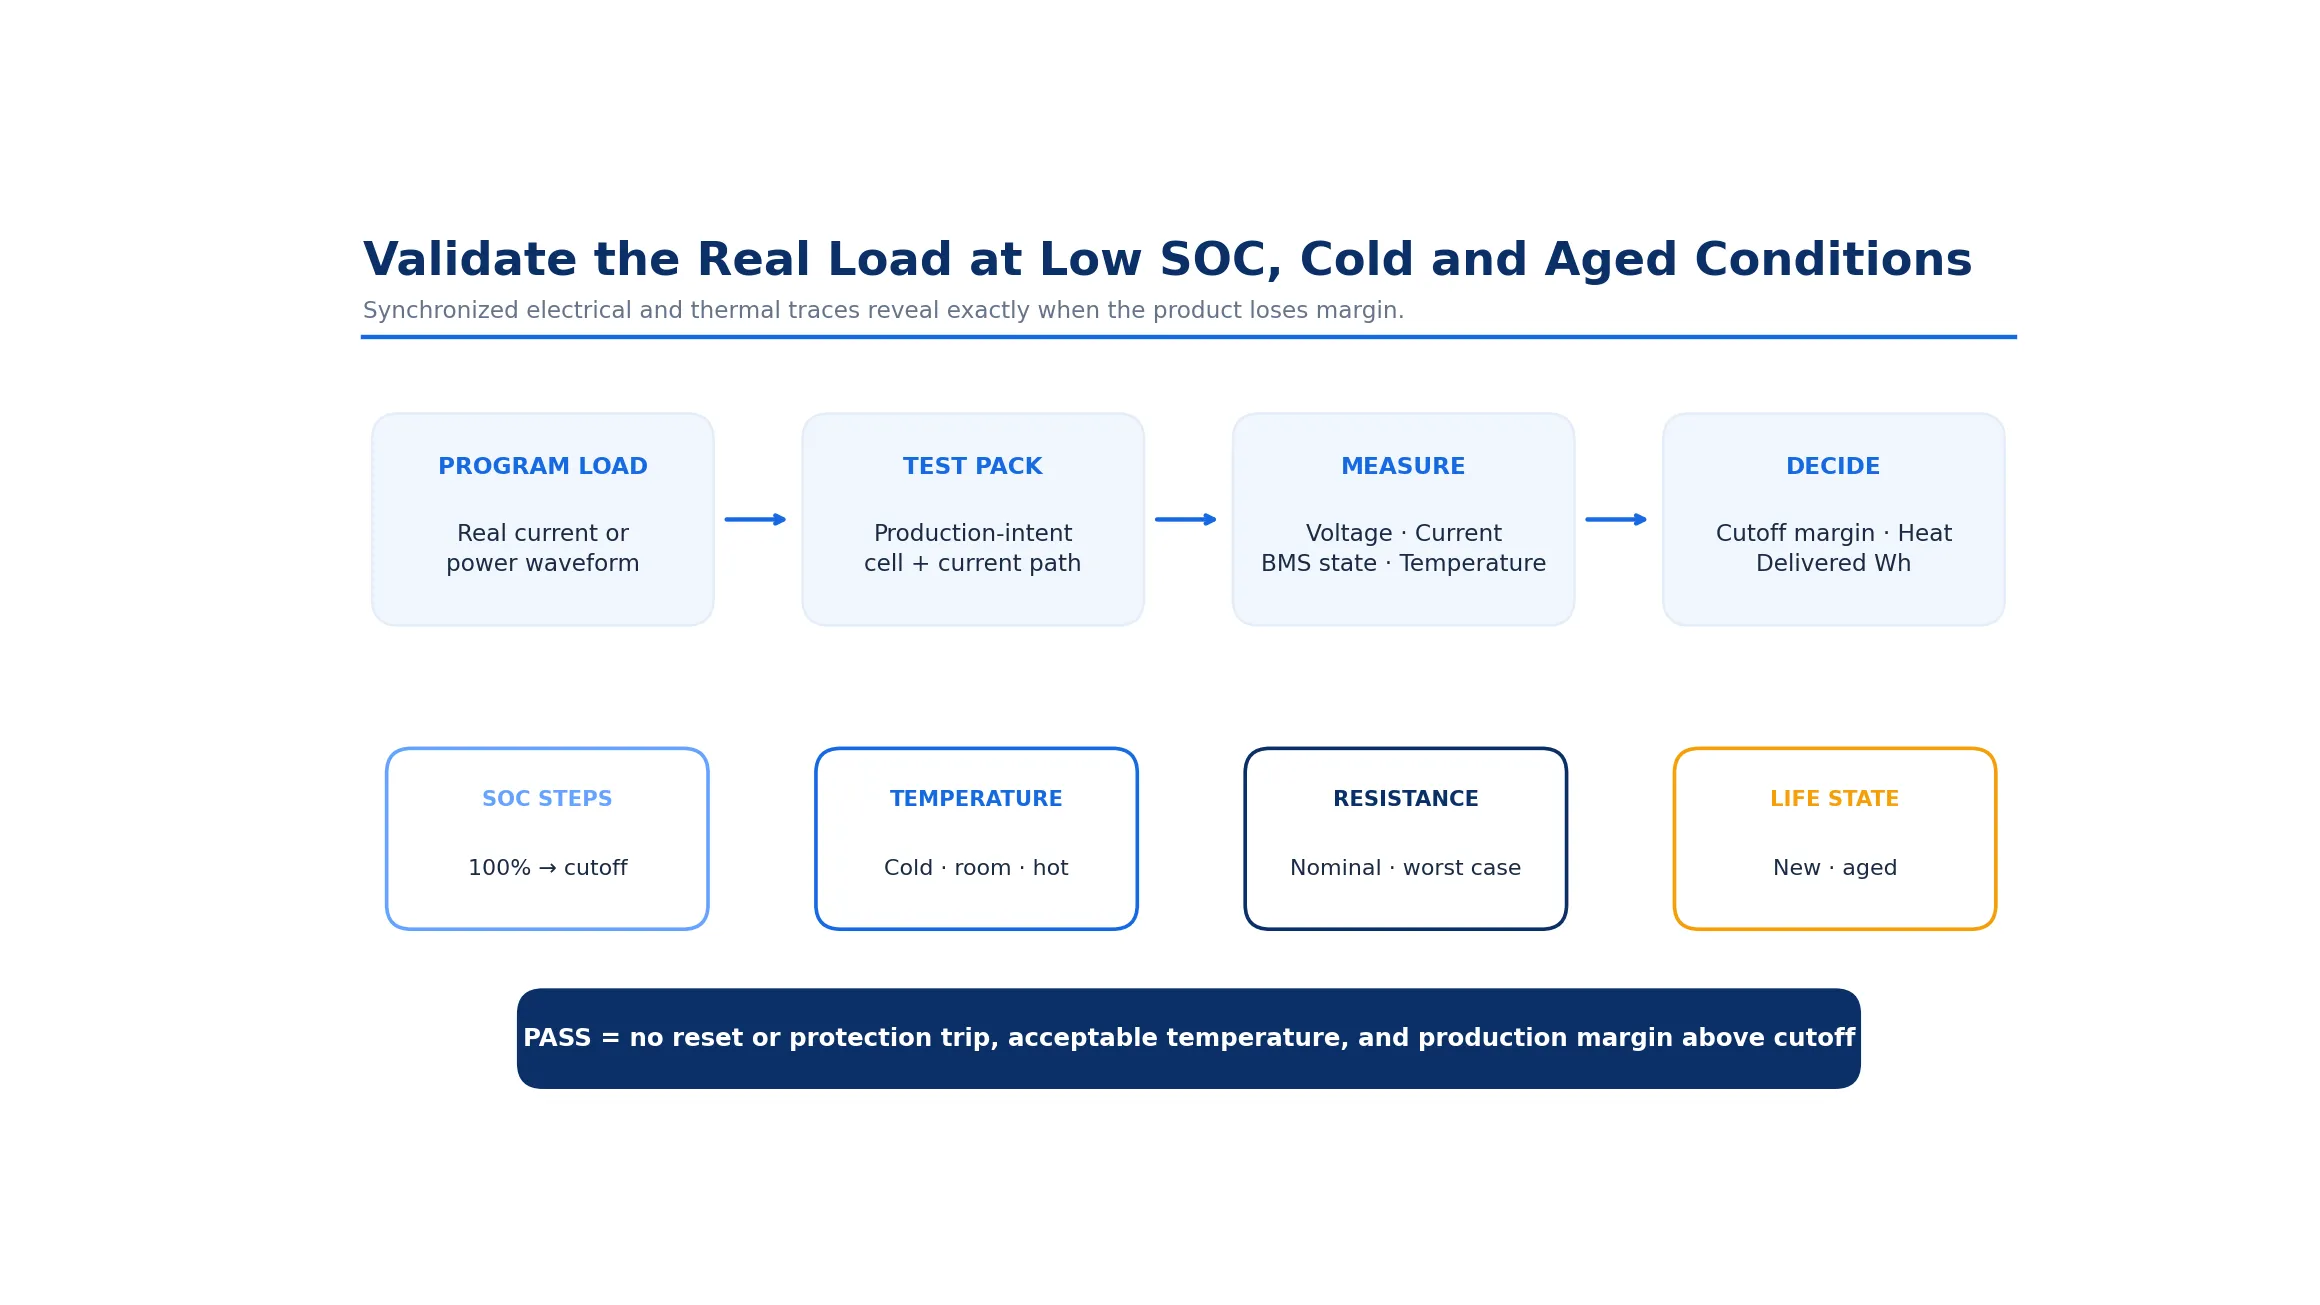
A datasheet can screen candidates. It cannot release a product. The tests below turn published numbers into evidence for the shipped battery.
| Test | Method | Decision it closes |
|---|---|---|
| Reference-capacity test | Repeat the supplier method closely enough to confirm cell identity, minimum capacity and lot consistency. | Valid baseline; not final runtime. |
| Dynamic load test | Apply the real current or power waveform in the production-intent pack and device. | Minimum loaded voltage, delivered Wh and nuisance-cutoff margin. |
| Low-SOC cutoff map | At controlled SOC steps, apply the critical pulse and record voltage, current, BMS state and recovery. | Exact SOC where the device can no longer meet the load. |
| Thermal path test | Repeat the duty cycle to thermal steady state while measuring cells, BMS, connector and wire. | Current path is acceptable, not merely the cell. |
| Margin and aging test | Repeat with cold cells, worst acceptable pack resistance and aged or resistance-shifted samples. | Production and end-of-life margin remain above cutoff. |
Samples used for abnormal, thermal-overstress or destructive testing should not be returned to normal performance comparison. Keep build records, cell lot, measured capacity, resistance, pack BOM and exposure history tied to every result.
For sample-stage evidence planning, connect this article with the Battery Pack Prototype Testing Guide so that electrical, thermal and mechanical results remain traceable.
Engineering Cases
Case 1: Higher mAh, Shorter Product Runtime
Project situation: A motorized device replaced a
lower-capacity power cell with a higher-capacity energy cell in the same
21700 envelope.
Hidden risk: The constant-power, cutoff-sensitive load
drew more current near low SOC, so the extra low-rate capacity became
inaccessible.
Engineering response: The team compared delivered
watt-hours above the device cutoff under the real duty cycle.
Buyer lesson: Runtime belongs to the complete
voltage-and-load system, not to the mAh label.
Case 2: ACIR Screening Passed, the 10-Second Pulse Failed
Project situation: Incoming cells met the factory 1
kHz impedance limit, but a handheld actuator reset during repeated
8-second loads.
Hidden risk: The acceptance test captured fast
impedance, not slower polarization, connector drop or heat accumulation
across repeated pulses.
Engineering response: The control plan retained ACIR
for lot screening and added 1-second and 10-second loaded-voltage limits
on the finished pack.
Buyer lesson: Use ACIR to screen consistency; use timed
DC loading to approve the application.
Case 3: A Same-Size Alternate Changed the Fuel-Gauge Result
Project situation: Purchasing proposed a 21700
alternate with similar capacity and voltage after the original cell
became difficult to source.
Hidden risk: Its resistance-versus-SOC profile
differed, so the gauge overestimated remaining runtime and the device
shut down above the displayed 10% SOC.
Engineering response: The team repeated the load
profile, updated the cell model and treated the alternate as a
controlled design change.
Buyer lesson: Same size and similar capacity do not
make cells electrically interchangeable.
Case 4: The Battery Still Had Capacity but Failed End-of-Life Power
Project situation: An aged field battery passed a
gentle capacity check but could not start a pump at low
temperature.
Hidden risk: End of life had been defined only by
retained capacity, not loaded-voltage margin under the real startup
pulse.
Engineering response: The release rule added cold,
aged, low-SOC pulse testing and a maximum pack-resistance limit.
Buyer lesson: For a power-limited product, useful life
ends when the required load can no longer be supported, even if low-rate
capacity remains acceptable.
What the Buyer Should Send and the Supplier Should Return
A supplier cannot solve a voltage-sag problem from the request “5000 mAh lithium battery.” The buyer should send the battery voltage window, real current or power waveform, device cutoff, converter behavior, ambient range, runtime target, charger profile, battery envelope, target life and known failure symptoms.
The supplier should return the exact cell model and lot-control route; capacity and resistance test conditions; complete pack resistance budget; charge, current and temperature boundaries; low-SOC validation plan; and revalidation path for any alternate cell. If the response only repeats capacity and maximum current, the real project risk has not been closed.
For enclosure-specific or failure-specific projects, THOR Power’s custom battery pack solutions can connect cell selection, pack design, validation and production controls in one review.
Final Cell Approval Rule: Release the Operating Envelope, Not the Datasheet
An exact cell is ready for OEM release only when the team can state where it works and where it does not. The approved specification should include the cell model and supplier route, minimum capacity, charge profile, timed resistance or loaded-voltage limits, current and temperature boundary, device cutoff, pack resistance budget and revalidation triggers.
| Release area | Metric | Approval rule |
|---|---|---|
| Normal runtime | Delivered Wh at the device input under representative duty cycle. | Passes target with production and aging margin. |
| Critical pulse | Minimum loaded voltage, current, duration and recovery. | No reset or BMS trip at the lowest approved SOC and temperature. |
| Thermal | Cell, BMS, fuse, connector and wire temperature after repeated duty. | All components remain inside approved limits. |
| Production | Minimum capacity, ACIR/timed DC response and pack-path resistance spread. | Pilot lots remain inside the validated envelope. |
| Change control | Cell, weld, BMS, fuse, connector, wire, firmware and charger changes. | Defined revalidation before shipment. |
Production release should also match controlled process capability. Review the THOR Power Production Process and relevant Certificates when documentation and repeatability matter for customer audits.
How THOR Power Supports Exact-Cell Selection
THOR Power can compare pouch, 18650, 21700 and LiFePO4 candidates against the real device voltage window and load profile. The review can include cell-model screening, current-path analysis, PCM/BMS and charger coordination, low-SOC pulse testing, thermal mapping, sample traceability, pilot-production controls and documentation tied to the shipped configuration. Review the available battery product families before freezing the cell route and pack architecture.
For projects already experiencing early shutdown or unexpected runtime, provide synchronized battery voltage, device input voltage, current, device state and temperature traces. The failure can then be separated into cell resistance, pack-path loss, cutoff logic, thermal limitation or fuel-gauge model error.
Key Takeaways
Capacity is measured charge to a stated cutoff; it is not the same as device-usable energy.
Under constant power, falling voltage increases current and I2R loss, so resistance can erase a capacity advantage.
ACIR, timed DCIR and discharge curves answer different questions and should be used together.
A lower-capacity power cell can provide longer practical runtime when the product is limited by voltage sag or peak current.
End of life for a power-limited product may be defined by loaded-voltage failure before capacity falls to 80%.
Approve the exact cell and complete pack under the real duty cycle, then control substitutions as engineering changes.
Conclusion
The deepest mistake in lithium battery selection is treating the largest capacity number as the product answer. A datasheet is a map of test conditions. The engineering task is to translate that map into loaded voltage, usable energy and thermal margin in the final device.
In a low-power product, the 5000 mAh cell may be the correct choice. In a cutoff-sensitive 100 W system, the 4500 mAh power cell may deliver more usable energy because it stays above the device limit. The decisive comparison metric is delivered watt-hours above the product cutoff under the real duty cycle.
Planning a Custom Lithium Battery Pack?
Send the device voltage window, real load waveform, cutoff behavior, charger profile, enclosure limits and target life. THOR Power can review exact cells, pack resistance, PCM/BMS settings and production evidence.
FAQ: Lithium Battery Datasheets and Real Runtime
Why can a higher-capacity lithium cell have shorter runtime?
Because the product may reach its minimum input voltage before the cell reaches the datasheet discharge cutoff. Higher cell and pack resistance create more voltage sag under load, leaving part of the rated capacity inaccessible.
Should I compare typical or minimum capacity?
Use minimum or rated capacity for conservative production planning, but only after confirming the test current, cutoff voltage and temperature. Even minimum capacity can overstate product runtime when the real load is heavier or the device shuts down earlier.
What is the difference between capacity and usable energy?
Capacity in amp-hours measures charge. Energy in watt-hours includes voltage. Usable energy is the energy delivered to the device before the first real system limit, such as undervoltage shutdown, BMS protection or a thermal limit.
Why does a constant-power load become harder near empty?
As battery voltage falls, the load draws more current to maintain the same power. The higher current increases voltage drop and I2R heating, which can push the battery below the device cutoff earlier.
Can I compare ACIR and DCIR directly?
No. ACIR is measured at a stated frequency, while DCIR comes from a defined current step or pulse. The results depend on SOC, temperature, pulse duration and sampling method. Use matched conditions or test the real waveform.
Is a cell datasheet continuous-current rating a pack rating?
No. Pack current is limited by the complete path, including tabs, welds, BMS MOSFETs, fuse, connector and wire. The finished pack must pass loaded-voltage and thermal testing.
What is the best test for early shutdown?
Run the real current or power waveform at controlled SOC steps and temperatures while recording battery voltage, device input voltage, current, BMS state and temperatures. The result should identify the SOC and condition where the device loses margin.
Can two 21700 cells with similar capacity be interchangeable?
Only after controlled comparison. They may differ in resistance-versus-SOC behavior, charge limits, current capability, thermal response, gauge model, dimensions, supply route and certification evidence.
Does 80% capacity retention define end of life?
Not always. A power-limited product can fail its loaded-voltage requirement while capacity remains above 80%. Define end of life from both retained energy and the ability to support the required load.
Is a datasheet enough to approve a lithium cell?
No. It is the starting evidence. OEM approval also requires exact-cell traceability, complete-pack design, final-device load and thermal tests, production variation review and change control tied to the shipped configuration.
Evidence standard: published numbers must remain tied to the exact manufacturer document and test condition. Calculations in this article are screening examples, not first-party performance guarantees. Final claims should be supported by traceable samples, calibrated electrical and thermal measurements, the production-intent pack and the shipped configuration.
Technical References
- Molicel product portfolio and archived INR-21700-M50A product data sheet cited for this comparison.
- Molicel INR-21700-P45B official product page and product data sheet.
- Texas Instruments — Theory and Implementation of Impedance Track Battery Fuel-Gauging Algorithm, Rev. A.
- IEC 61960-3:2017 — Performance tests and requirements for portable secondary lithium cells and batteries.
- IEC 62133-2:2017+A1:2021 — Safety requirements and tests for portable sealed lithium cells and batteries.
- UNECE — UN Manual of Tests and Criteria, Revision 8 and Amendment 1.



Dr. Maximilian Weber is THOR Power's Chief Scientist and a senior expert in lithium battery technology. His technical review focuses on battery safety, performance optimization, energy density and custom battery solution development.
Last technical review: September 2026

Victor Xiong holds a Master's degree from The Chinese University of Hong Kong, Shenzhen. He leads THOR Power's OEM Division and focuses on custom battery solutions for global device brands, product developers and industrial customers.